Service graphs
|
|
|
|
Graph Information
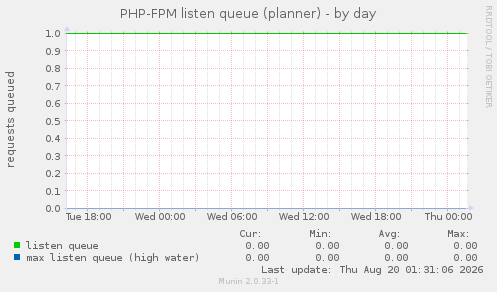
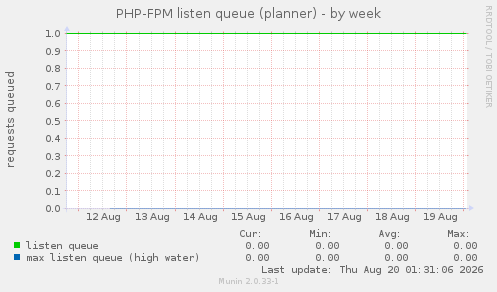
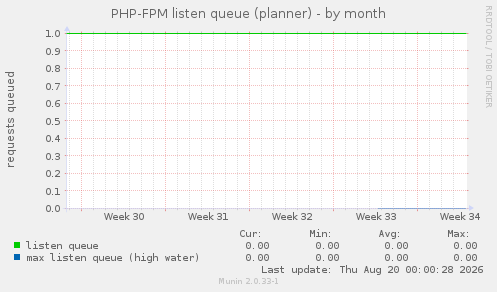
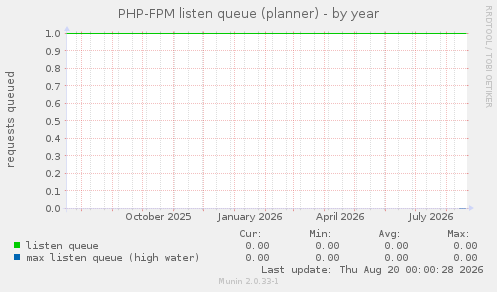
Requests waiting for a free worker. ANY sustained non-zero value means requests are being delayed -- this is the graph that shows saturation before users complain.
| Field | Internal name | Type | Warn | Crit | Info |
|---|---|---|---|---|---|
| listen queue | queue | gauge | 1 | 10 | |
| max listen queue (high water) | maxqueue | gauge |